
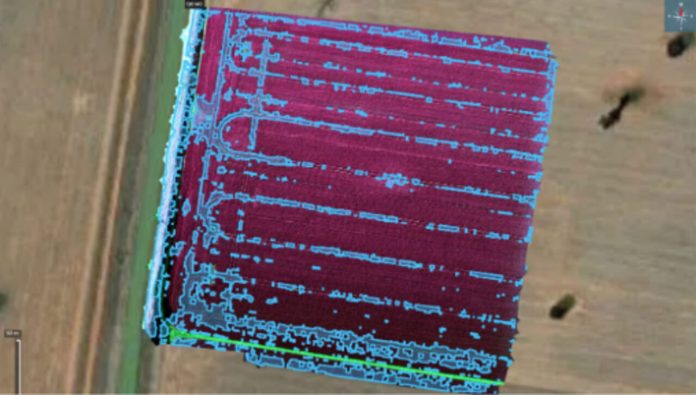
Every grower knows the frustration of spraying hectares that may not need it, while ryegrass pressure sits in patches across the paddock. AGnVET’s drone-based weed mapping service is being developed to change that, giving growers a clearer picture of where ryegrass is actually located before spray decisions are made.
Instead of relying on broad paddock assumptions, the service turns drone imagery into practical weed maps that show where attention is needed most. Using drone imagery and specialist mapping software, ryegrass patches can be identified across a paddock and converted into maps that help guide spray decisions before the boom goes across the paddock.
For some growers, the map may be used as a visual guide on a GPS screen. For others, it can be turned into a prescription file for compatible rate controllers, section control or nozzle control systems. The aim is to provide information in a format that suits a grower’s existing equipment, rather than requiring every business to have the most advanced spray setup before they can benefit.
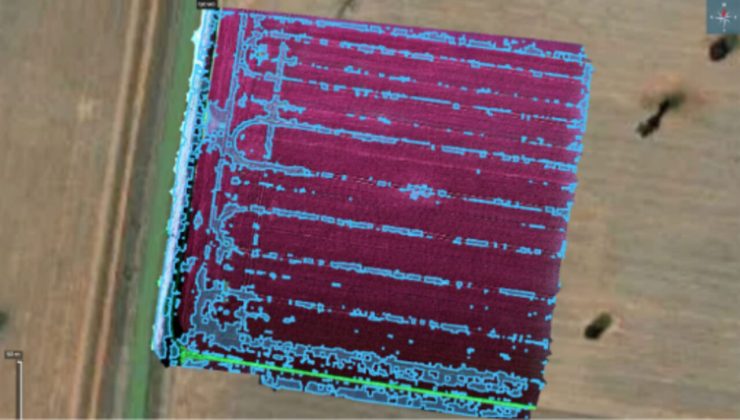
The value lies in shifting from broad paddock assumptions to paddock-specific information. Instead of treating every hectare the same, growers can see where weed pressure is concentrated and focus control efforts where they are needed most. This creates an opportunity to reduce unnecessary chemical use, lower input costs and improve spray efficiency.
Ryegrass remains one of the most persistent and costly weeds in broadacre systems, particularly where resistance pressure is building. Accurate patch maps provide growers and agronomists with another layer of information to support herbicide strategy, assess paddock risk and monitor changes in weed pressure over time. The same technology is also opening up opportunities beyond weed mapping. In corn, drones can be used to assess plant population and establishment across the paddock, providing a fast and visual way to understand how evenly the crop has emerged.
Using Sentera Field Agent software, drone imagery can be transformed into colour-coded population heatmaps that highlight areas of stronger and weaker establishment. These maps can help identify planter performance issues, emergence variability, drainage or soil constraints, and areas where yield potential may have been reduced early in the season.
Together, weed maps and crop population heatmaps show how drone technology can support a broader precision agriculture approach. By turning paddock imagery into practical, easy-to-interpret data layers, growers can make more informed decisions about crop protection, establishment, input use and in-season paddock management.
For more information on these services or other ways to maximise your production, please contact your local AGnVET store or agronomist.